Ocean exploration has come a long way since Jacques Cousteau and Émile Gagnan invented the Aqua-Lung in 1943, an apparatus that allowed humans to breathe underwater for limited periods of time. But much about the body of water that occupies a whopping 71% of the earth’s surface remains unknown. Specifically, only around 20% of the global seafloor has been mapped thus far. Efforts to do so have been splintered as different organizations conducting projects have mostly operated in silos.
But working with only a limited map of the ocean floor remains a big problem for one looming reason: climate change.
Charting new territory
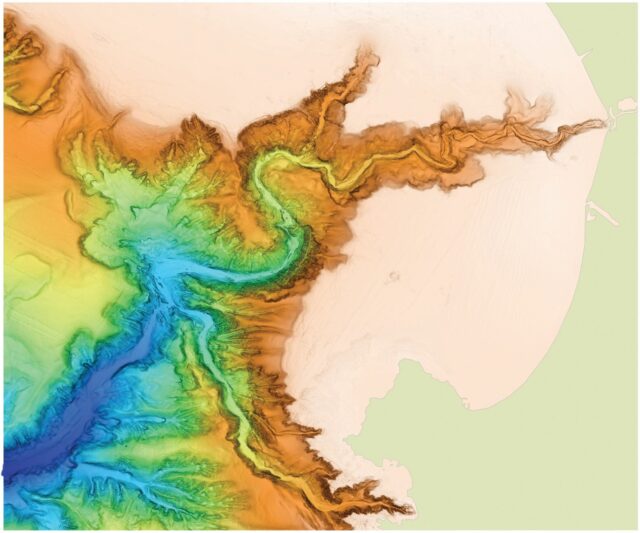
For one thing, scientists need to understand how to navigate rising sea levels. Ocean mapping is important for clearer modeling of the effects of climate change, says Brian Connon, vice president of ocean mapping at Saildrone, a company that designs, manufactures and operates wind and solar-powered uncrewed surface vehicles (USVs) on the ocean. GPS systems and an onboard computer help the USVs follow prescribed paths. “To understand how sea level is going to rise or what the inundation after a hurricane will be, you need high-resolution bathymetric maps,” Connon says. A bathymetric map details the 3D features of the floors of water bodies.
Knowing what is on the ocean floor will be key to preserving habitats, Connon adds.
The ocean may also offer hope in actively battling global warming by supporting alternative energy production. Every offshore wind farm project, for example, needs to start with a geophysical understanding of the seafloor. “Otherwise, you’re just guessing. You don’t know if there is sand or silt. You need to understand if there’s bedrock,” says Anthony DiMare, CEO and co-founder of Bedrock, a public benefit technology startup that is working toward a scalable, lower-cost system for nearshore, shallow-water hydrographic surveys (3D details) of the ocean floor.
Tidal power, which harnesses energy from tides, requires similar knowledge. Carbon sequestration and hydrogen production (by splitting seawater) are also promising technologies that rely on the ocean. Exploring these energy alternatives without actually understanding what the ocean floor looks like is akin to flying blind. You cannot afford to make mistakes when time is of the essence—the United Nations’ Global Sustainable Development Goals have a target date of 2030.
Rising stakes
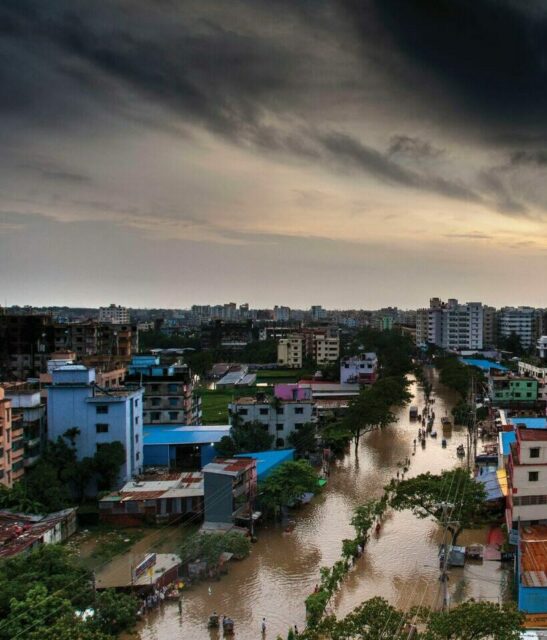
In 2020, global sea level rose 3.6 inches above 1993 levels, a new record high, according to the U.S. National Oceanic and Atmospheric Administration. Rising sea levels means threatened infrastructure and imperiled coastal communities, as well as more frequent flooding due to powerful storms that push waters increasingly inland. A study in Nature Communications found that high tides may displace as many as 150 million people by 2050.
Rising ocean temperatures also threaten the water’s biodiversity, killing off species that cannot take the heat. Learning how the ocean is going to change is key to understanding species’ habitats and preserving biodiversity. By studying the physical makeup of the ocean floor, scientists can better understand where species make their homes and what might be needed on the path to adaptation.
Additionally, the ocean is a basis for renewable energy. Offshore wind platforms must be situated on the ocean floor, requiring manufacturers to understand the foundation before they can build. Meanwhile, promising technologies are exploring how to produce hydrogen while capturing carbon from the air and sequestering it in the ocean as carbonates. Seawater splitting—where ocean water can be split into hydrogen as fuel—is also being considered. While these technologies are ramping up slowly, they will need to lean on the ocean as a foundation.
Harnessing the rising tides of tech
Hydrographic surveys, which detail the seafloor, have evolved over decades. In the 19th century, the best maps of the seafloor came from what are known as sounding lines. Just as an echo in a valley rebounds, acoustic systems sent sound down to the ocean floor and recorded the time it took to reach the bottom and back. Measuring the different times at different distances gave a rough idea of the features (mountains, valleys, etc.) of the ocean floor.
GPS satellites came later. But tracing the details of the seafloor using satellites is like figuring out the details of a moving airplane with the naked eye. “It is really only a gross topography,” says Dr. Charles Paull, a senior scientist at the Monterey Bay Aquarium Research Institute (MBARI), a center for ocean research and technology development in Monterey, California. He indicates that the resultant maps were mostly rough sketches. “[They do] not provide enough detail at resolution to be able to understand the seascape and what it might look like or the processes that formed it,” Paull says.
Early maps served their purpose for maritime navigation, but addressing climate change will demand more rigor in seafloor mapping.
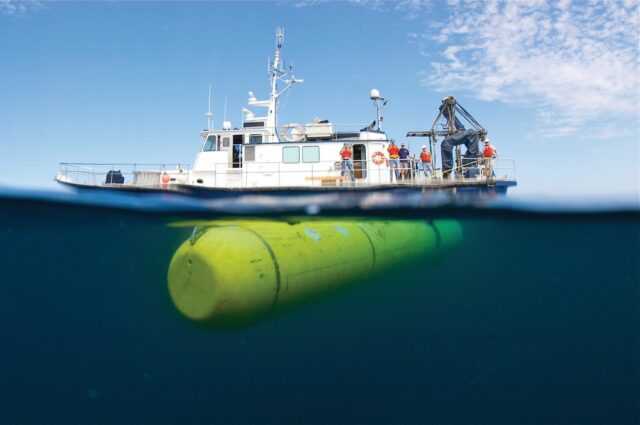
Multibeam sonar techniques are huge improvements. They send out many sonar beams—in a fan shape—that cover the ocean a lot faster. They have a downside, however. High-frequency sonar beams are dulled by water. “The ocean is a really harsh environment,” says DiMare. “Different layers of the ocean will have different salinities that will bend the sound in different ways. You have to understand the chemical layers the sound has to pass through.” To bypass these headaches, instead of shooting sonar beams from the ocean’s surface down to the depths, researchers are launching autonomous vehicles from the surface into the water, bringing the mapping apparatus as close to the ocean floor as possible.
MBARI, for example, launches autonomous underwater vehicles (AUVs) on programmed missions from small ships. MBARI concentrates on collecting extremely high-resolution (1m x 1m) maps of small patches of the ocean floor. These surveys are used to understand the geologic processes that shape the seafloor. The areas of operation are most commonly off the U.S. West Coast.
Bedrock’s AUV eliminates the need for boats entirely and supports missions in water depths less than 300 meters and/or 90 kilometers from shore. It can be launched from any beach or coastal infrastructure and generates comprehensive high-resolution data.
Mapping the entire seafloor as the basis for understanding the ocean and tackling climate change will need technology that covers wide swaths of the sea. Saildrone’s selling point is that its wind-powered USV can be dispatched to practically any location in the ocean. “We can go way offshore with our Saildrone Surveyor and map down to 7,000 meters,” Connon says. The onboard engine is used only when needed to charge batteries. The Surveyor is a 72-foot USV that Saildrone deploys.
Saildrone’s USVs can sail close to shore as well, and the Surveyor carries the same elaborate echo sounders as ships. Repeated measurements—missions can take many weeks—deliver comprehensive datasets that are combed for spurious interference before being delivered.
Who owns the data?

While interest from private enterprises for energy exploration and governmental organizations has enabled the mapping of the ocean floor thus far, only 20% has been covered.
There is an increasing clamor not only to fully map the ocean floor but also to make that data publicly available. Efforts like the Seabed 2030 Project, a collaboration between the Nippon Foundation of Japan and the General Bathymetric Chart of the Oceans, hope to bring together all available data “to produce a definitive map of the world ocean floor by 2030.” While high-resolution maps mean a clearer picture of the ocean floor, resolution will depend on practical limits: The project forecasts that a little more than 72% of the ocean floor will be mapped to a resolution of 400m x 400m. Bedrock is a Seabed 2030 Project partner and promises to make a medium-resolution version of its ocean maps freely available on its cloud platform, Mosaic.
At a fundamental level, mapping the oceans will be critical to protecting the planet, Connon says. “We have only this world we live in, and we need to take care of it, but we don’t know what we don’t know right now about the ocean,” he says. Any ocean-based endeavor to fight climate change will need a deep understanding of the seafloor, DiMare points out. “We really need to understand the geophysical nature of the ocean. It’s a humanitarian imperative that we map the ocean floor.”
Want to read more stories like this? Check out Realize magazine.
Lead photo by Vicki Smith/Getty Images