Want to have more control over troubleshooting issues on your Isilon cluster? How about being able to resolve common issues yourself, bypassing the support queue? Well, you’re in luck! The Isilon Self-Service Platform utility (SSP) allows you to do just that. Use the SSP utility to perform first-line troubleshooting on your cluster. You’ll be using the same utility that EMC Isilon Technical Support Engineers and Field Representatives use to prevent and troubleshoot a wide range of known issues that occur on Isilon clusters.
Note: The SSP utility runs only on Windows platforms.
How the SSP utility works
The SSP utility analyzes a cluster log set: it does not run live on the cluster. You first collect the cluster log files (the *.tgz files), then run the SSP utility. The utility runs a series of checks on the cluster log files and generates a diagnostic report of the current health of the cluster. You can run checks for specific categories such as pre-upgrade or health check, or choose specific checks for a custom run.
After the analysis completes, the Overall Health screen presents a summary of the basic health of your cluster. It includes high level details about the cluster and the names and status of the individual nodes on the cluster. Summary results are color-coded: red for critical, orange for needs attention, and green for okay. And to help you resolve issues, the report provides links to the relevant documentation.
You can run the SSP utility using its command line interface or the SSP GUI.
Getting the Self-Service Platform utility
Go to the Isilon Self-Service Platform Info Hub and download and unpack the SSP .zip file. The .zip file contains the SSP utility executable file as well as the user guide.
Collecting the cluster log files
Before running the SSP utility, you must collect the cluster log files. You can use the isi gather command or the OneFS WebUI to collect the files. After they’re collected, copy them to a convenient location that the SSP utility can access. When you run the SSP utility, you specify the location of the log files, a location for the results files, and choose the check(s) that you want to run. The SSP utility places the generated results files for each test in a separate folder in the results location that you specified.
KB article 304468 explains how to collect the log files, complete with a video demonstration.
Running the SSP utility
To run the SSP utility, double-click the Isilon_Self-Service_Platform.exe file. The main screen appears:

(Click the image to see a larger version.)
Click the Help button in the upper left to view the SSP utility’s FAQ page.
Enter the log location, your service request (SR) number, and the output path for the generated diagnostic report. After you click next, you can choose the checks to run. You’ll see a screen with tabs for each of the check categories: pre-upgrade, post-upgrade, health, firmware, and custom, as the following figure shows.

(Click the image to see a larger version.)
The checks include:
- Cluster level checks such as overall health of the cluster, patches installed, InfiniBand configuration and upgrade service status
- Cluster configuration checks such as whether or not ESRS is enabled, file sharing configuration, priority of all routable gateways and whether any gateways share the same priority
- Node level checks such as boot flash drive problems, NVRAM battery status, mismatched nodes, node health, amount of free space, and uptime
- Node status checks such as the DMI log, device errors, kernel open files, NIC status, netstat connections, and the cluster’s var/crash partition
- Disk level checks such as disk load for all disks in each node, node drive bay health, drive errors, and any errors reported in the idi.log file
You can select the checks to run based on category, such as pre-upgrade check, or use the Custom tab to select only those checks you’re interested in:

(Click the image to see a larger version.)
After you select the checks you want, click the Run button. You’ll see a progress indicator at the bottom of the screen and the SSP utility’s UI is disabled for the duration of the run.
The report results output structure
After the run completes, the SSP utility presents a summary of the results, similar to the following figure (with identifying information redacted).
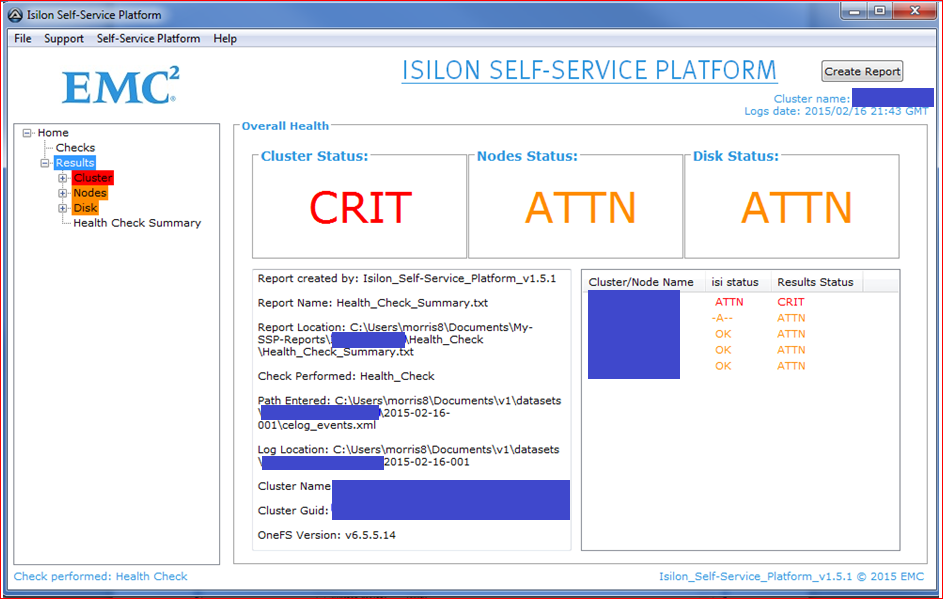
(Click the image to see a larger version.)
You’ll find the results in the folder you specified for the output. The generated results output file structure is similar to the following.
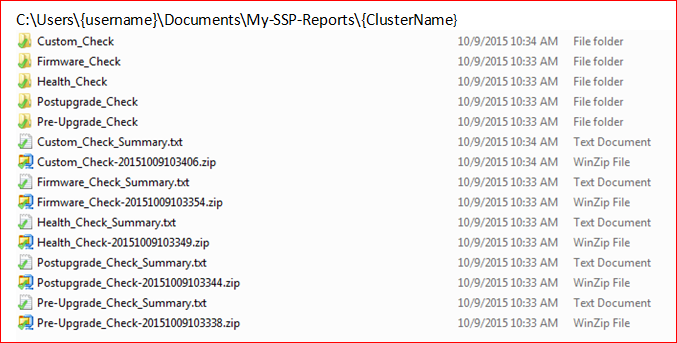
(Click the image to see a larger version.)
Go get it!
The SSP utility is a great way to take charge of troubleshooting and performing preventative health checks to resolve or avoid common, known issues on your cluster. Check out the Isilon Self-Service Platform Info Hub for the latest download and documentation. And for information about collecting log files (complete with a video demonstration), see KB article 304468.
Let us know!
Let us know what you think. If you have feedback for us about this or any other Isilon technical content, email us at isicontent@emc.com. And thank you!